
Statistically Speaking, Mass Shootings Are Not Random, Independent Events
Introduction
Mass shootings are among the most hideous crimes. What horrifies many are the suddenness and randomness of these murders. They occur unpredictably, often in settings familiar to most: The workplace, houses of worship, nightclubs, movie theaters and schools.
This post examines whether mass shootings follow the Poisson distribution. Poisson is a discrete probability function that provides the probability of events occurring during a specific period of time or space. Poisson presupposes that the events are independent and random.
The randomness and independence of mass shootings in any given year make these tragedies candidates for the Poisson distribution. While there is evidence that mass shootings are random, constant and independent events, a visual and statistical exploration of this phenomenon suggests otherwise.
Poisson Distribution
The Poisson distribution is a useful statistical tool because we can use it to calculate the probability of a given number of events occurring in a certain period of time. While it may be difficult to predict a mass shooting, the Poisson distribution could tell us the probability of six mass shootings occurring in a year, or even the probability of fewer than three in a year. Irrespective of the relative rarity of these events, such information could be useful to researchers and law enforcement.
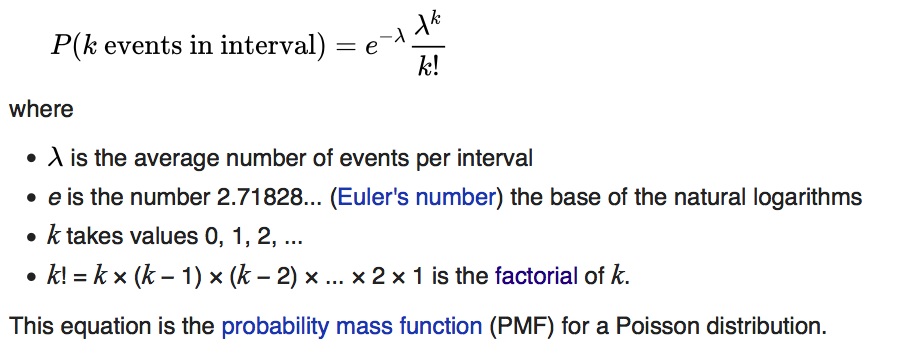
(The probability mass function for the Poisson distribution. We will use this formula to produce the expected values for mass shootings. Source: Wikipedia)
The classic application of the Poisson distribution involved deaths in the Prussian army by horse kicks. A researcher was able to show that these events followed the Poisson distribution almost perfectly. In fact, there was a 97 percent probability that there would be two or fewer annual horse kick deaths in the Prussian army. The Prussians were therefore able to assume that the horse deaths were random and independent.
It’s pretty cool if you think about it: The Poisson distribution gives us the power to predict the probability of completely random, unrelated events occurring. As one scholar reflected, it gives us “a model for stuff that just happens…”
Poisson and Mass Shootings
There are a few ways we can prove that mass shootings follow the Poisson distribution: 1. We can visualize a Poisson distribution and compare it to a visualization of mass shootings; 2. We can conduct a Chi-Squared Goodness of Fit hypothesis test using the expected values of a Poisson distribution and the actual values of mass shootings; and/or 3. We can conduct a hypothesis test using Fisher’s exact test.
Visualizing Mass Shootings
A first step in deciding whether mass shootings follow Poisson is to visualize them. We can graph the number of mass shootings per year and then compare it to the expected values from a Poisson distribution. For this, we will use data provided by the Mother Jones mass shooting database.
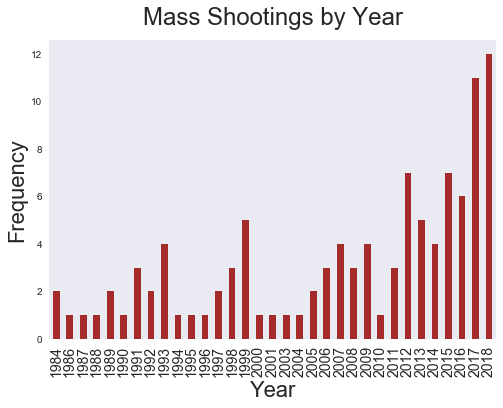
(Mass shootings appear to be rising)
A Poisson distribution requires that data be constant, independent and random. As we see from the above visualization, mass shootings did not occur at a perfect, constant rate; if anything, they occur at an increasing rate. While the recent spikes in mass shootings are evidence against the data following Poisson, Poisson does not exclude the possibility of some variation. In fact, a perfectly ordered rate might provide evidence that the data is neither independent nor random.
Let’s compare the frequency of mass shootings to the expected Poisson values. First, we need to calculate the counts for the annual frequencies of mass shootings. Next we will create the expected values using the mean number of annual mass shootings (There are on average 3 per year). We then plug this mean into the probability mass function for each frequency (there are nine in total). Last, we plot both distributions and compare.
Python Code
import math

x =range(1,10)

poisson_counts =[]

for i in x:
    PMF = round\
    ((float((math.exp(1)**-3)*(3)**i))/float(math.factorial(i))*33,0)
    poisson_counts.append(PMF)
(Python loop applying the Poisson probability mass function to create the expected values for nine mass shooting observations)
As we can see in the visualization below, the distribution of mass shootings fits imperfectly the Poisson distribution; nevertheless, the fit is close enough for horseshoes. It could be that we don’t have enough data to visualize a good fit. In the death by horse kick example above, the Prussian army had a century of data. Mother Jones has collected fewer than four decades of data. This visualization is therefore inconclusive evidence one way or the other. We will need other methods to confirm a Poisson distribution.
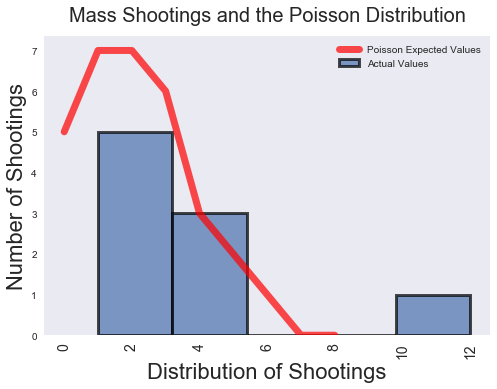
(This graph compares the actual mass shooting values to those expected under a Poisson distribution)
Chi-Squared Goodness of Fit Test
A few years back, a writer for wired.com linked the Poisson distribution to mass shootings using a Chi-Squared Goodness of Fit test. His test produced a p-value greater than 0.05, meaning that there was nothing statistically significant in the distribution of mass shootings compared to Poisson. They were the same statistically speaking.
The journalist cautioned that the while his p-value was not statistically significant, it was still low. He surmised that the rate of mass shootings was rising, and that this change in rate could indicate that the phenomenon is neither random nor independent. As we established above, the phenomenon has continued to rise since he wrote the article in 2012, so his observation may very well be correct.
We can conduct a similar Chi-Squared hypothesis test using updated values through 2018. The null hypothesis is that the proportions in the distributions are similar (i.e. mass shootings follow Poisson). The alternative hypothesis is that at least one category does not match (i.e. the distribution of mass shootings does not follow Poisson). We will reject the null hypothesis if we find a p-value < 0.05.
When we conduct our Chi-Squared test, we get a p-value of 0.0, meaning that we reject that null hypothesis. The proportions are not the same. In other words mass shootings do not follow the Poisson distribution. The logical deduction is that these events are neither random nor independent.
There’s one problem with this conclusion: The Chi-Squared Goodness of Fit test works best when there are more than five observations of a given expected value. In our expected Poisson distribution, we have several values that are lower than five. There’s a good chance that our p-value is inaccurate.
There’s another problem: The best alternative to the Chi-Squared test – the Fisher’s exact test– requires a 2x2 contingency table. Our data is in a 9x2 format.
There is one statistical trick available to work around this obstacle. By combining all instances with four of fewer values into one row, we can compact our expected values and actual observations into a 3x2 table. When we run our Chi-Square test again, we get a p-value of 1.71e-05. With a p-value <.05, we reject the null hypothesis. The distribution of mass shootings do not follow the Poisson Distribution
Implications
There are several implications for our finding that mass shootings follow Poisson. The first is that mass shootings are neither random nor independent. It also means that the probablity of these events cannot be predicted utilizing Poisson.
 import scipy.stats as sc

 poisson= sc.stats.distributions.poisson

 annual_mean= 3

 probability=[]

 for i in range(1,13):
     answer =  poisson.pmf(i, annual_mean)
     probability.append(answer)

print 'The probability of fewer than three mass shootings per year: {p}'.format(p = round(sum(probability[0:3]),2))

print 'The probability of two to eight mass shootings per year: {p}'.format(p = round(sum(probability[2:8]),2))

print 'The probability of having greater than five mass shootings per year: {p}'.format(p = round(sum(probability[5:]),2))
(Python code producing the probability of mass shootings pursuant to the Poisson distribution. We produced several expected values less than five which makes the Chi-Square test less reliable)
If mass shootings did follow Poisson, we could calculate the probablity of each occurrence with some precision:
Poisson probability of at least one mass shooting per year: 0.80
Poisson probability of fewer than three mass shootings per year: 0.60
Poisson probability of two to eight mass shootings per year: 0.57
Poisson probability of having greater than five mass shootings per year: 0.08
Conclusion
Mass shootings do not follow the Poisson distribution. Though previous research showed that it did, the distribution of mass shootings spiked over the past few years. They are less random over time. The fact that our data does not neatly fit Poisson visually further confirms our conclusion.
This of course means that mass shootings are neither random nor independent. This is not surprising as researchers at Arizona State University recently found that mass shootings occur in clusters, and may even be contagious. Such a finding means that mass shootings may inspire future mass shootings, and for this reason alone, they cannot not follow the Poisson distribution.
Even though we cannot calculate the probabilities of mass shootings on an annual basis, recent spikes suggest that there is a strong likelihood that these mass murders will continue. It’s clear that policy makers must address the issue with a sense of immediacy. We know that they are not random nor independent. Let’s find out if there are any other externalities contributing to the phenomenon.